Probability, Odds Ratio and Relative Risk
Assumptions
Standard statistical methods assume that the outcome of an event A for each individual is independent of the outcome for the other individuals
Probability and Odds are related terms
Prob (A) = proportion of events that are A
Value of Prob (A) = 0 to 1
Odds (A) = Prob (A happens)/ Prob (A does not happen)
Value of Odds (A)= 0 (when Prob (A)=0) and Infinity (when Prob (A)=1)
Odds (A) = Prob (A)/1-Prob(A)
Prob (A) = Odds (A) / 1+ Odds (A)
For example
If P (A)=0.5, Odds (A)= 0.5/1-0.5= 1
If Odds (A)=2, Prob (A)= 2/(1+2) =0.66
If Odds (A)=3, Prob (A)= 3/(1+3)= 0.75
Notes
Odds are always larger then probability , since 1-Prob(A)<1
When the probability is small (<0.1), the value of odds approximates to value of probability.
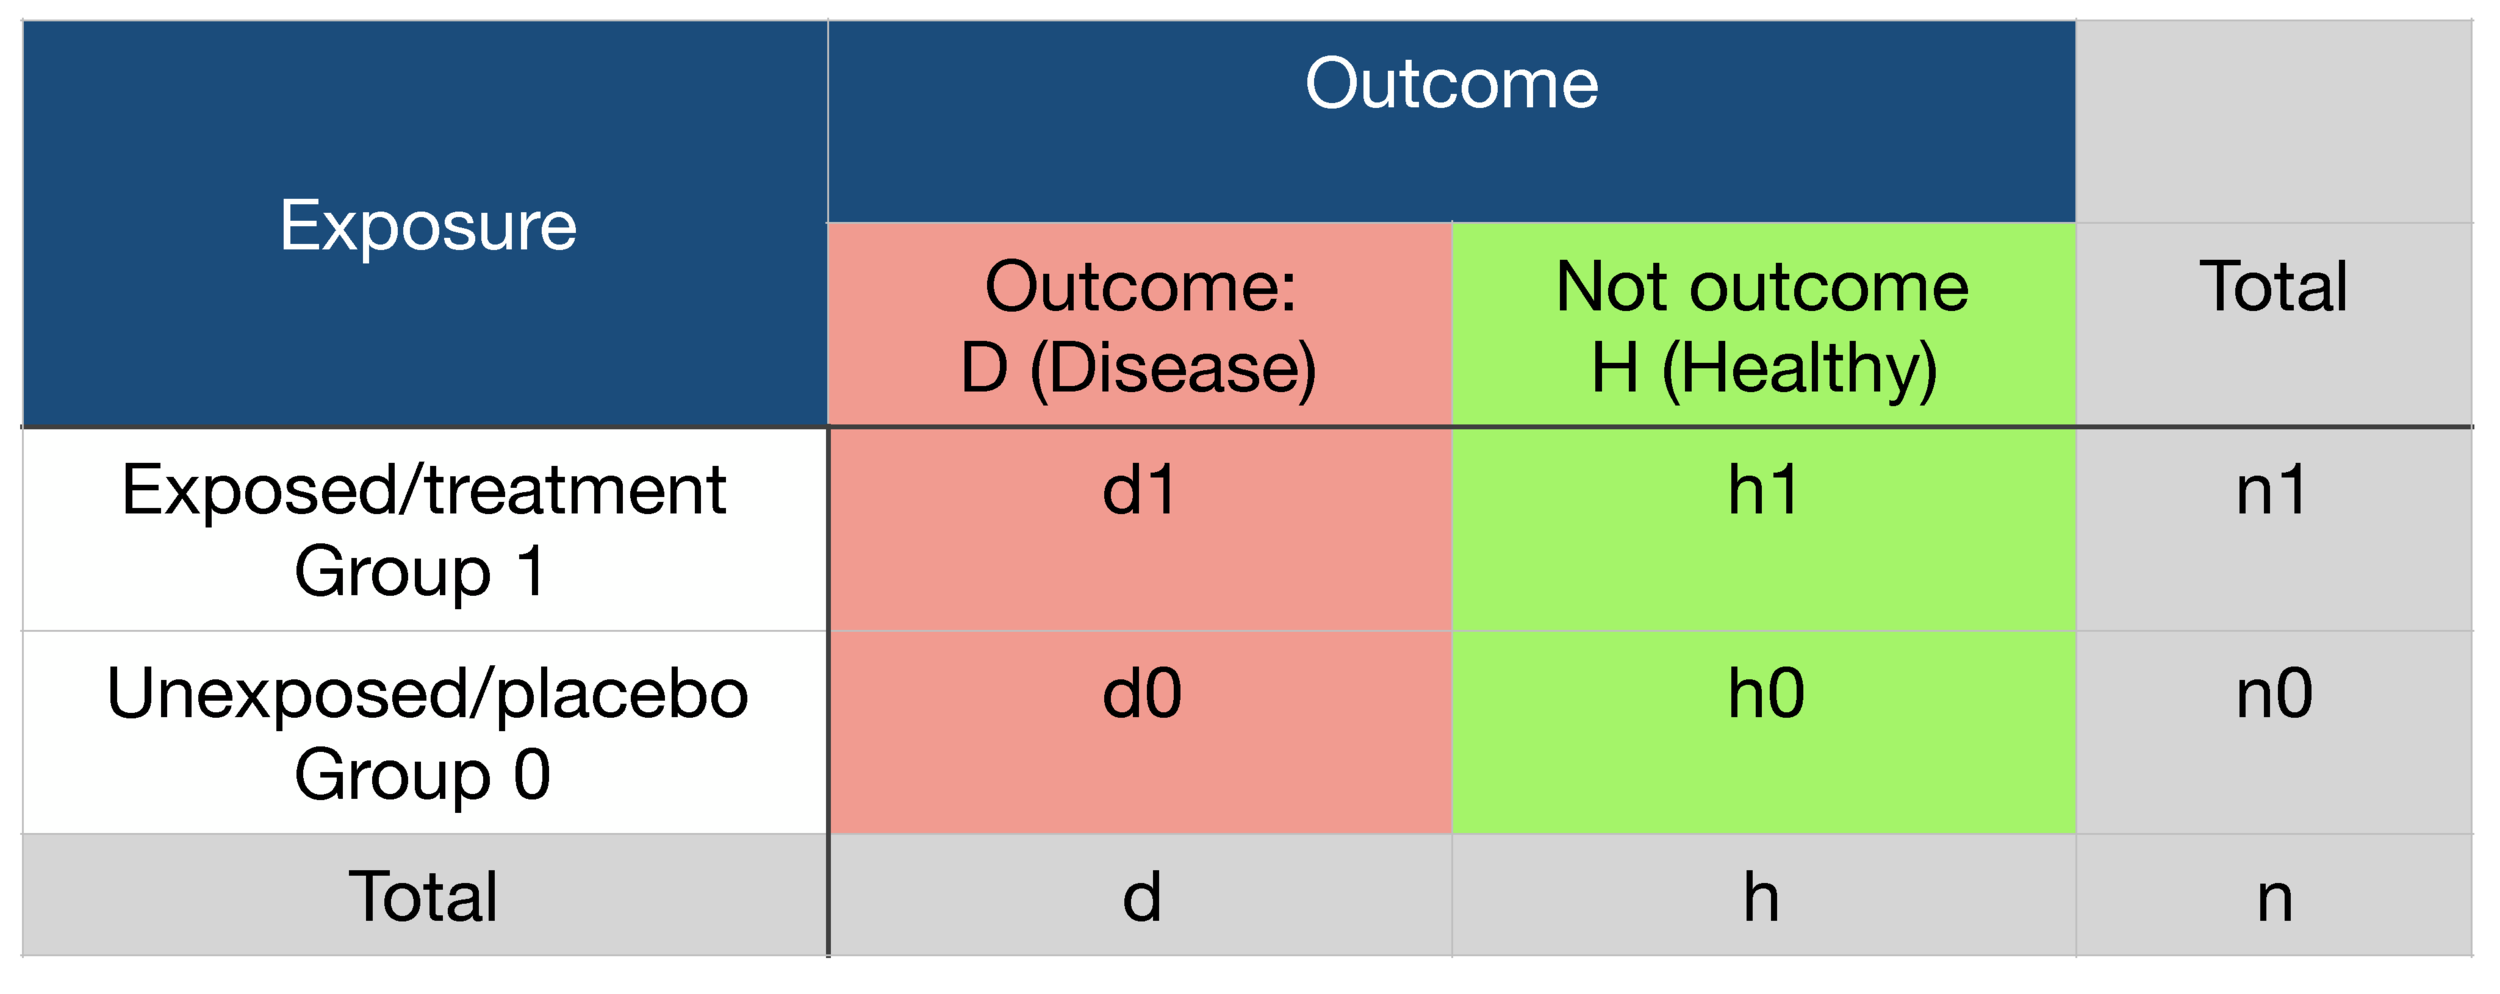
2 x 2 contingency table
Binary outcome data reported by two exposure groups (such as exposed vs non-exposed or treatment vs placebo) can be compared using a 2 x 2 contingency table.
The magnitude of the exposure effect is numerically expressed as:
Risk difference
Risk Ratio (Relative Risk)
Odds Ratio
(Absolute) Risk Difference
Risk difference (RD) = Absolute risk (AR) in Group 1 - Absolute risk (AR) in Group 0
Risk difference (RD) = Prob (D in Group 1) - Prob (D in Group 0)
Risk difference (RD) = d1/n1 - d0/n0
Risk Ratio (Relative Risk)
Risk Ratio (RR) = Absolute risk (AR) in Group 1 ÷ Absolute risk (AR) in Group 0
Risk Ratio (RR) = Prob (D in Group 1) ÷ Prob (D in Group 0)
Risk Ratio (RR) = d1/n1 ÷ d0/n0
Odds Ratio
Odds ratio (OR) = Odds (D in Group 1) ÷ Odds (D in Group 0)
Odds ratio (OR) = d1/h1 ÷ d0/h0
Odds ratio (OR) = (d1x h0) ÷ (h1 x d0) (cross-product ratio)
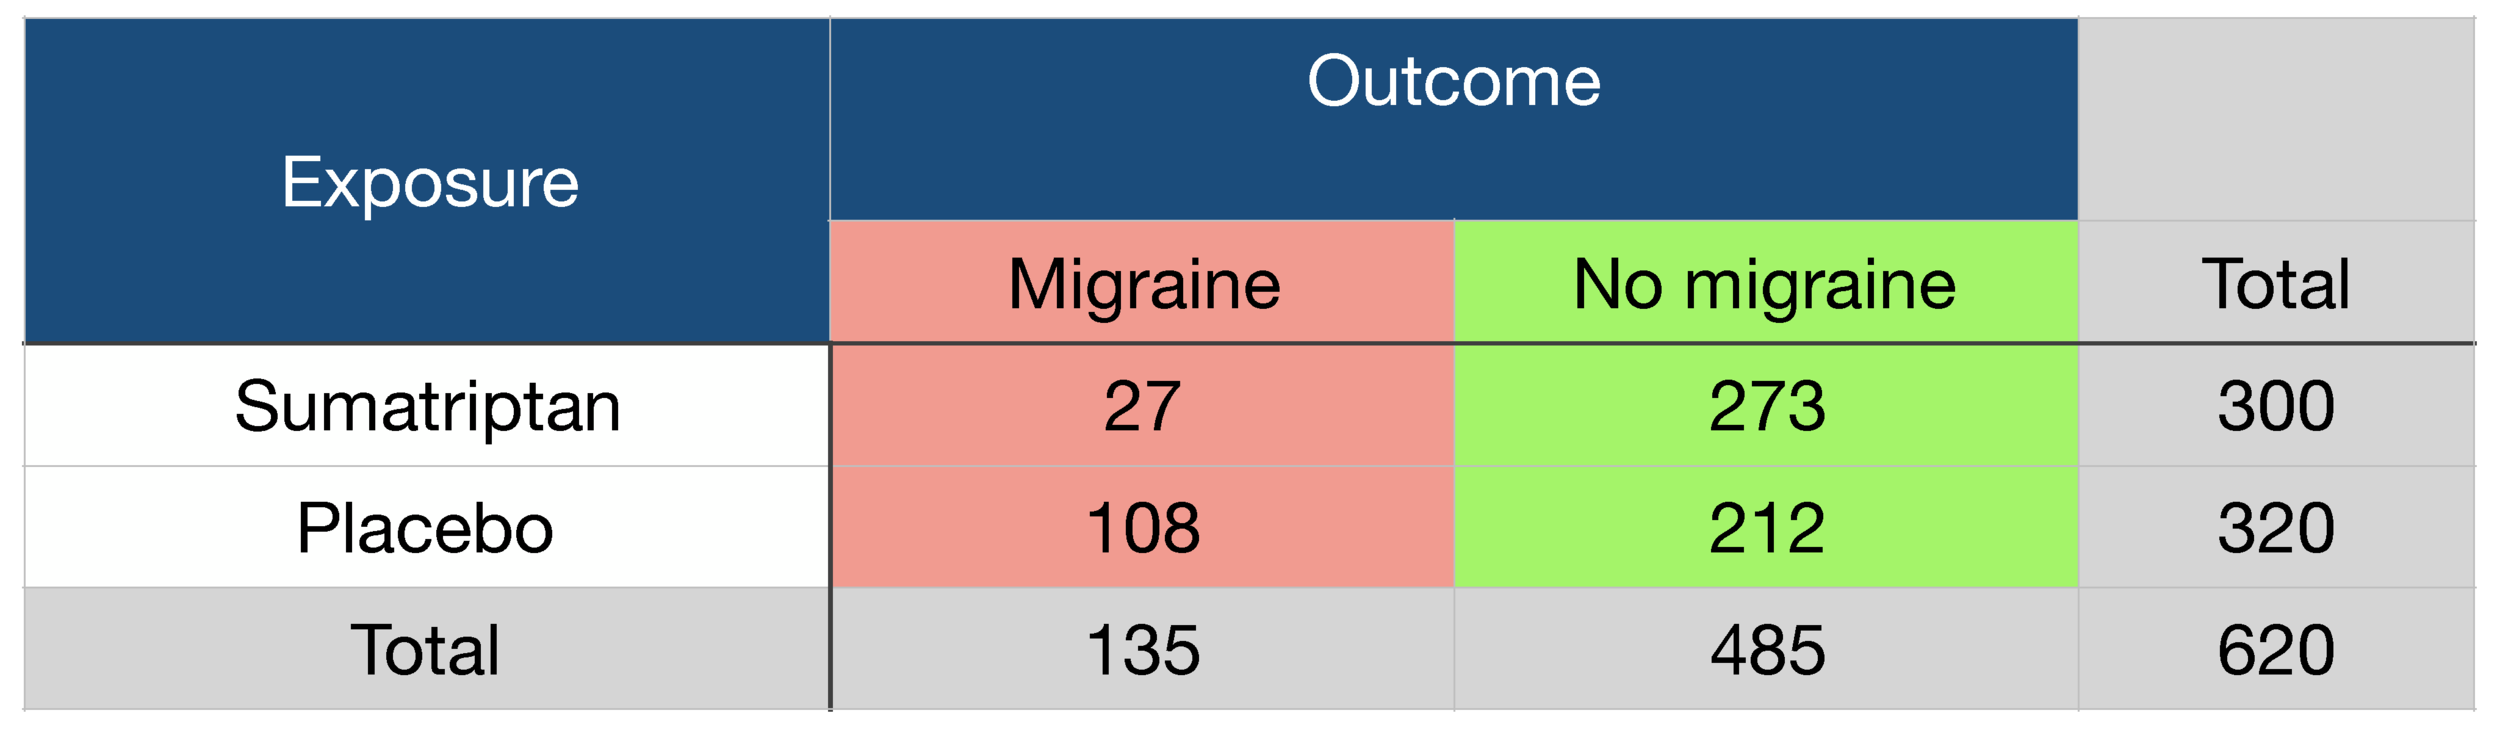
Worked example
Effectiveness of sumatriptan as a treatment for migraine:
Risk difference (RD) = 27/300 - 108/320 = - 0.248
ARR (absolute risk reduction) of migraine = 24.8%
Risk Ratio (RR) = 27/300 ÷ 108/320 = 0.267
Odds ratio (OR) = (27x 212) ÷ (273 x 108) = 0.194
Relative Risk Reduction (RRR) = 0.248 ÷ 108/320 = 0.735
Relative risk of reduction of migraine = 73.5%
NNT = 1/ARR = 4.03 = number of patients who need to be treated to prevent 1 additional migraine
Properties of odds ratios
Minimal value is 0, maximum value is infinity
OR =1, means the odds (hence proportions) are the same in the two groups
Odds ratio is always further away from 1 than corresponding RR
If RR>1 then OR>RR
if RR<1 then OR<RROR for disease EQUALS the reciprocal of OR for healthy. OR (disease) = 1/OR (healthy)
For a rare outcome, the OR is approximately equal to the RR
OR for the exposure ( odds of disease in exposed group ÷ odds of disease in unexposed group) EQUALS
OR for the disease (odds of exposure in disease group ÷ odds of exposure in healthy group).
This equivalence is fundamental to the utilisation of OR in case-control studies.OR = d1/h1 ÷ d0/h0 = d1/d0 ÷ h1/h0
OR are the measure of choice in case-control studies.
It is not possible to estimate risk of disease, risk difference or risk ratios from case-control studies.
Using Risk Difference to calculate NNT or NNH
Consider,
Absolute risk (AR) in Experimental/Treatment group= AR Exp
Absolute risk (AR) in Control/Placebo group= AR Control
1. If treatment reduces the risk of an adverse event:
ARR (absolute risk reduction): AR Exp - AR Control , only for adverse events.
RRR (relative risk reduction): ARR for adverse events / AR Control for adverse events
NNT (number needed to treat): The number of patients who need to be treated to prevent 1 additional adverse outcome (in comparison with the control treatment)
Calculated as 1/ARR
2. If treatment increases the risk of a beneficial event:
ABI (absolute benefit increase): AR Exp - AR Control , only for beneficial events
RBI (relative benefit increase): ABI for beneficial events / AR Control for beneficial events
NNT(number needed to treat): The number of patients who need to be treated to create 1 additional beneficial outcome (in comparison with the control treatment).
Calculated as 1/ABI
3. If the treatment increases the risk of an adverse event:
ARI (absolute risk increase): AR Exp - AR Control , only for adverse events.
RRI (relative risk increase): ARI for adverse events / AR Control for adverse events
NNH (number needed to harm): The number of patients who, if they received the experimental treatment, would lead to 1 additional person being harmed compared with patients who receive the control treatment.
Calculated as 1/ARI
Evidence that the difference is not explicable by chance: P-value
A test which indicates whether the difference between the data groups is statistically significant.
The p-value is the probability of obtaining the difference by chance, at least as large as that observed, if the null hypothesis (no difference) is true.
A p-value of 0.05 means there is a 1 in 20 risk that the resulting difference occurred by chance alone.
The lower the p-value, the greater the strength of evidence against the null hypothesis.
A p-value <0.05 provides sufficient evidence against the null hypothesis to indicate the difference is statistically significantly different.
A p-value <0.01 provides even stronger evidence against the null hypothesis.
Rejection of the null hypothesis means the alternate hypothesis (a statistically significant difference) is likely to be true.
Confidence interval (CI)
The CI quantifies the uncertainty in measurement; usually reported as 95% CI, which is the range of values within which we can be 95% sure that the true value for the whole population lies.
If the confidence interval for relative risk includes the value 1, then there is insufficient evidence to conclude that the two groups are statistically significantly different.
Hazard ratio (HR)
Statistical Tests
Binary outcome variable in two exposure groups:
Risk Difference, Risk Ratio, Odds Ratio, Chi-Squared test for 2 x 2 table, Exact test for small samples
Numerical outcome variable in two exposure groups:
Comparison of two means: Normal distribution z-test (large sample sizes) or T-test (small sample sizes)
Numerical outcome variable in more than two exposure groups:
One-way analysis of variance (ANOVA)
Rates and Survival time analysis between two exposure groups:
Hazard ratio (log rank test)
Cox (proportional hazards) regression